mirror of
https://github.com/TECHNOFAB11/zfs-localpv.git
synced 2025-12-12 06:20:11 +01:00
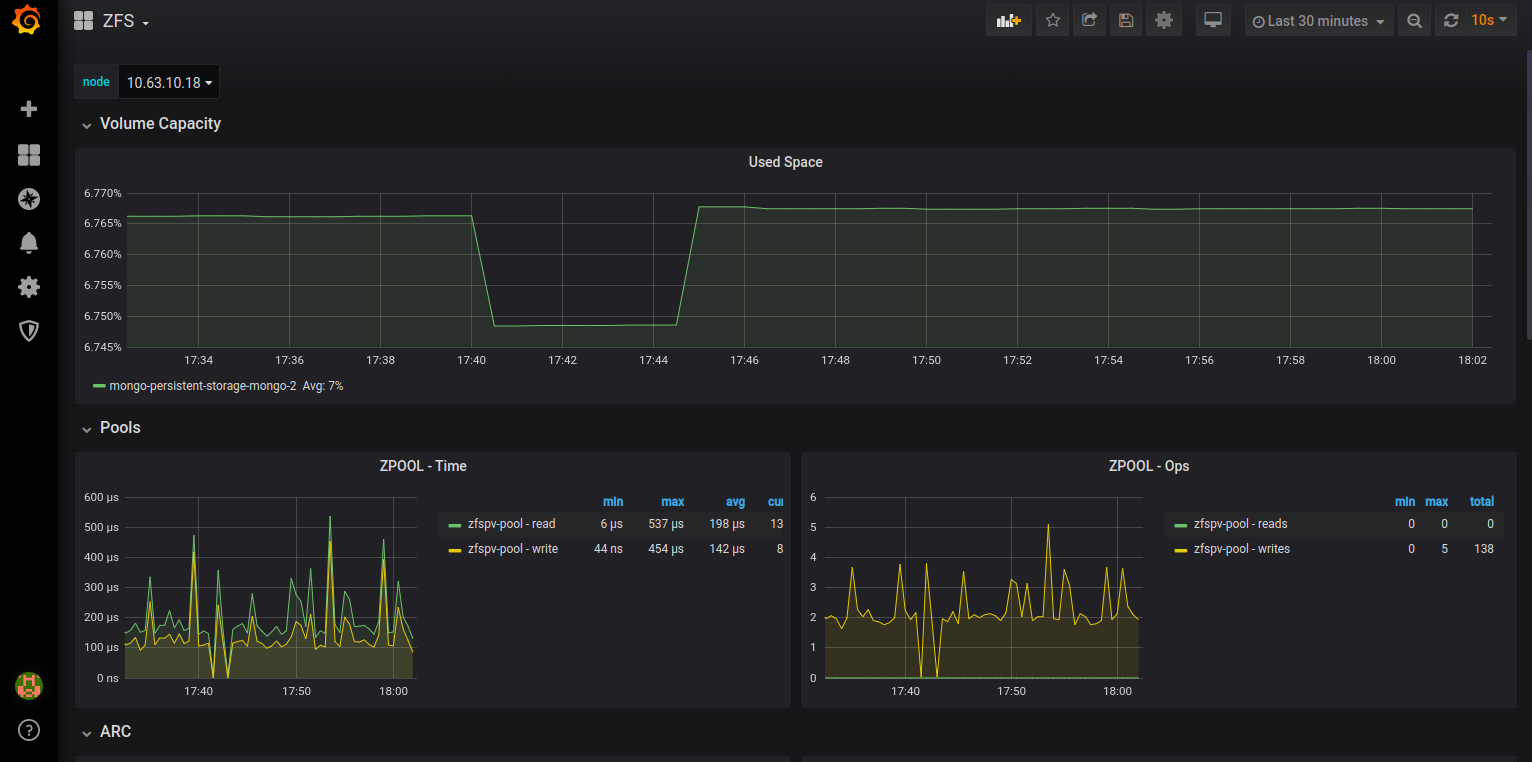
adding grafana dashboard for ZFS Local PV that shows the following metrics:

- Volume Capacity (used space percentage)
- ARC Size, Hits, Misses
- L2ARC Size, Hits, Misses
- ZPOOL Read/Write IOs
- ZPOOL Read/Write time

This dashboard was inspired by https://grafana.com/grafana/dashboards/7845

Signed-off-by: Pawan <pawan@mayadata.io>
119 KiB
1532x762px
119 KiB
1532x762px